Problems app
- Overview
- 15-min read
Quickly triaging, investigating, and remediating incoming incidences is the core challenge for operations teams.  Problems supports them by automatically analyzing complex incidences, collecting all the context, and presenting the root cause and impact within a consistent view.
Problems, backed by data from Grail and Davis® AI analysis, helps operational and site reliability teams reduce the mean time to repair (MTTR) by presenting every aspect of the incident.
Permissions
The following table describes the required permissions.
Installation
Make sure the app is installed in your environment.


Aim and context
This page shows you how to use Problems to triage detected problems and investigate their root cause and impact.
Target audience
This page is written for:
- Operations engineers
- Pipeline engineers
- Systems engineers
- Site reliability engineers (SREs)
- Build automation engineers
Summary
Problems streamlines triage, analysis, and remediation of active incidents by reducing the MTTR. It allows you to focus on AI-detected problems and quickly navigate to their root cause.
- The data provided by Grail and DQL makes it possible to slice and dice all problem-related information for huge amounts of problems and events.
- Integration with context-specific Dynatrace apps allows you to analyze problems without the need to switch the context.
Investigate and remediate active problems
By default, Problems shows:
- A feed of all problems in the last 2 hours. To help operation teams spot open problems regardless of which filter is set, open problems remain on top of the feed no matter how long they are open.
- A problem chart at the top visualizes any abnormality with a high number of problems in the past. Select a peak on the chart to drill into it and investigate further.

Filtering
To focus on your domain and triage problems that affect it, set filters. The two most common filters—Status and Category–have selectable settings to the left of the table for quick access. To set other filters, use the filter bar above the table.
- Status—Can be
ActiveorClosed.- If this is not set, all problems (active or closed) are listed.
- If you select a status in the controls on the left, the corresponding filter is also displayed in the filter bar.
- Category—Indicates the nature of the incident, such as slowdowns, errors, resource-related issues, or availability incidents.
- If you select one or more categories in the controls on the left, the corresponding filters are also displayed in the filter bar.
Filtering with the filter bar allows you to focus your feed on problems based on multiple criteria, such as status, number of affected entities, root cause entity, and more. Place your cursor in the input field to see all the available options. By default, filtering criteria are combined by the AND logic. For each criterion, Davis provides a list of suggested values, based on your problem feed.
For example, to see problems that are raised due to an increase of JavaScript errors and that persist for longer than 1 hour, use the following filter criteria:
Status=ACTIVEDuration>1hCategory=ErrorName=JavaScript error rate increase
The problem filter bar supports Boolean logic filters. This allows you to combine AND and OR criteria and create complex filters using parentheses to group Boolean terms. You can see a Boolean logic filter statement within Problems app in the example below.

Leverage predefined Team Segments to increase operational productivity
Segments are predefined filters used for quickly filtering the data to include only the relevant entries. In the context of Problems, you or your team can utilize a predefined set of team-specific segments to filter your problem tables instead of having to create your own problem filters.
The following example shows how to use segments to filter problems connected to easyTravel.

In addition, using segments in Problems allows you to:
- Create sets of filters that can be reused by you and shared to the whole team.
- Save time on recreating filters applied during the previous sessions.
- Increase productivity by quickly filtering relevant problems.
- Quickly check the status of your service by creating and applying service-specific segments.
Since problems are stored as events in Grail, segments created for filtering problems must define an event filter. For example, if you want to filter problems that were raised in a specific cloud region, you can create a segment with the following event filter:
cloud.region = "us-east-1c" AND event.kind = "DAVIS_PROBLEM"

Segment filters are directly applied to the problem Grail records. Consequently, no entity filters are applied to the problem unless the entity ID is chosen as a primary field of the filtered problem.
For more information on segments and how they work, see Segments  .
.
To make sure you always catch incoming problems, use the refresh settings 
 in the upper-right corner of Problems.
- To automatically refresh the problem feed, select and choose a refresh rate (or select
Offto turn off automatic refresh) - To manually refresh the problem feed at any time, regardless of the automatic refresh setting, select
To see the details of a problem
- In the table, select the problem ID in the ID column.
- Review the details page.
The problems details page provides all available details about the problem, highlighting the root cause entity with a red mark, to guide your attention to the right things. The example below shows details of a problem with user action degradation—including the root cause entity (easyTravelBusiness service) and a chart of abnormal response time of that service.

All entities affected by the problem are listed in the Affected entities section, along with information about entity type and the number of events, detected during the analysis.
- As a suggestion for the starting point of the investigation, Davis marks the entity that it determined to be the root cause of the problem.
- To review details about an affected entity, select it in the table.
Compare multiple problems
If all the filters are applied and you still have multiple problems to investigate, you can select and compare the details of multiple problems.
-
In the table, use the checkboxes to select two or more problems.
-
Select Show details.
This preloads the details of all selected problems and adds controls to the upper-right corner of the problem details page so you can quickly switch between each selected problem.
Dynatrace receives events from multiple event sources, such as OneAgent, Synthetic, extensions, and ingestion APIs. Dynatrace accepts and understands various properties (also referred to as fields) of those events that provide additional information about the event.
Event sources can be customized to provide the information you need to analyze and remediate problems caused by the events. For example, linking the configuration that detected the event (dt.settings.schema_id and dt.settings.object_id) helps you to quickly adapt the threshold or baseline if such action is necessary.
Another example is adjusting the sensitivity of the anomaly detector that triggered the event by modifying the detector's configuration in the settings.
Since available event properties depend on the event's source, events that are not generated by anomaly detectors don't contain links to relevant event settings. If you want an event to link to a settings object, you can do so by attaching a dt.settings.object_id property to events ingested via API and/or extensions.
Problems displays all event properties for each collected event in a table and provides intent links, such as direct navigation to an anomaly detector's configuration, as shown below.

Examples of powerful event properties include:
- Event description (
event.description). The event description supports Markdown-formatted text, enabling you to include links to resources that can help to remediate the problem. - DQL query (
dt.query) allows you to rebuild the event's chart in a notebook or at a dashboard or to copy the raw value of a property. - Related entities (
dt.entity.*) allow you to directly navigate to entities through thedt.entity.*properties. - Link to a settings object (
dt.settings.object_id) and settings schema (dt.settings.schema_id).
To learn more about the semantics and syntax of event properties and how they can be used across Dynatrace, see Semantic Dictionary.
For cases when your software tools create integration gaps preventing you from effective usage of Dynatrace data, we provide the ability to export problem feed data in the CSV format. You can later use this data in various tools, including spreadsheet programs, databases, and data analysis tools.
As illustrated below, you can export problem related-data from the problem feed table. You can also export it from Notebooks and Dashboards within all table visualizations.

You can export all loaded problems (up to a limit of 1000) or use the multi-select feature to choose specific problems. Additionally, the filter bar above the table allows you to filter through larger subsets of problems. The Select all checkbox helps you to export all problems in the filtered set of entries.
Depending on your team's responsibility, you might want to focus your attention on Kubernetes clusters, cloud resources, and workloads of critical services. To minimize context switching, Dynatrace offers consistent root cause information across multiple apps. No matter where your investigation starts, you don't have to switch to Problems to see the root cause.
In the example below, the Kubernetes app displays information about a problem affecting a workload.

A Davis-analyzed problem highlights the root cause of an incident and shows all the incident-relevant log lines across multiple entities in the problem details.
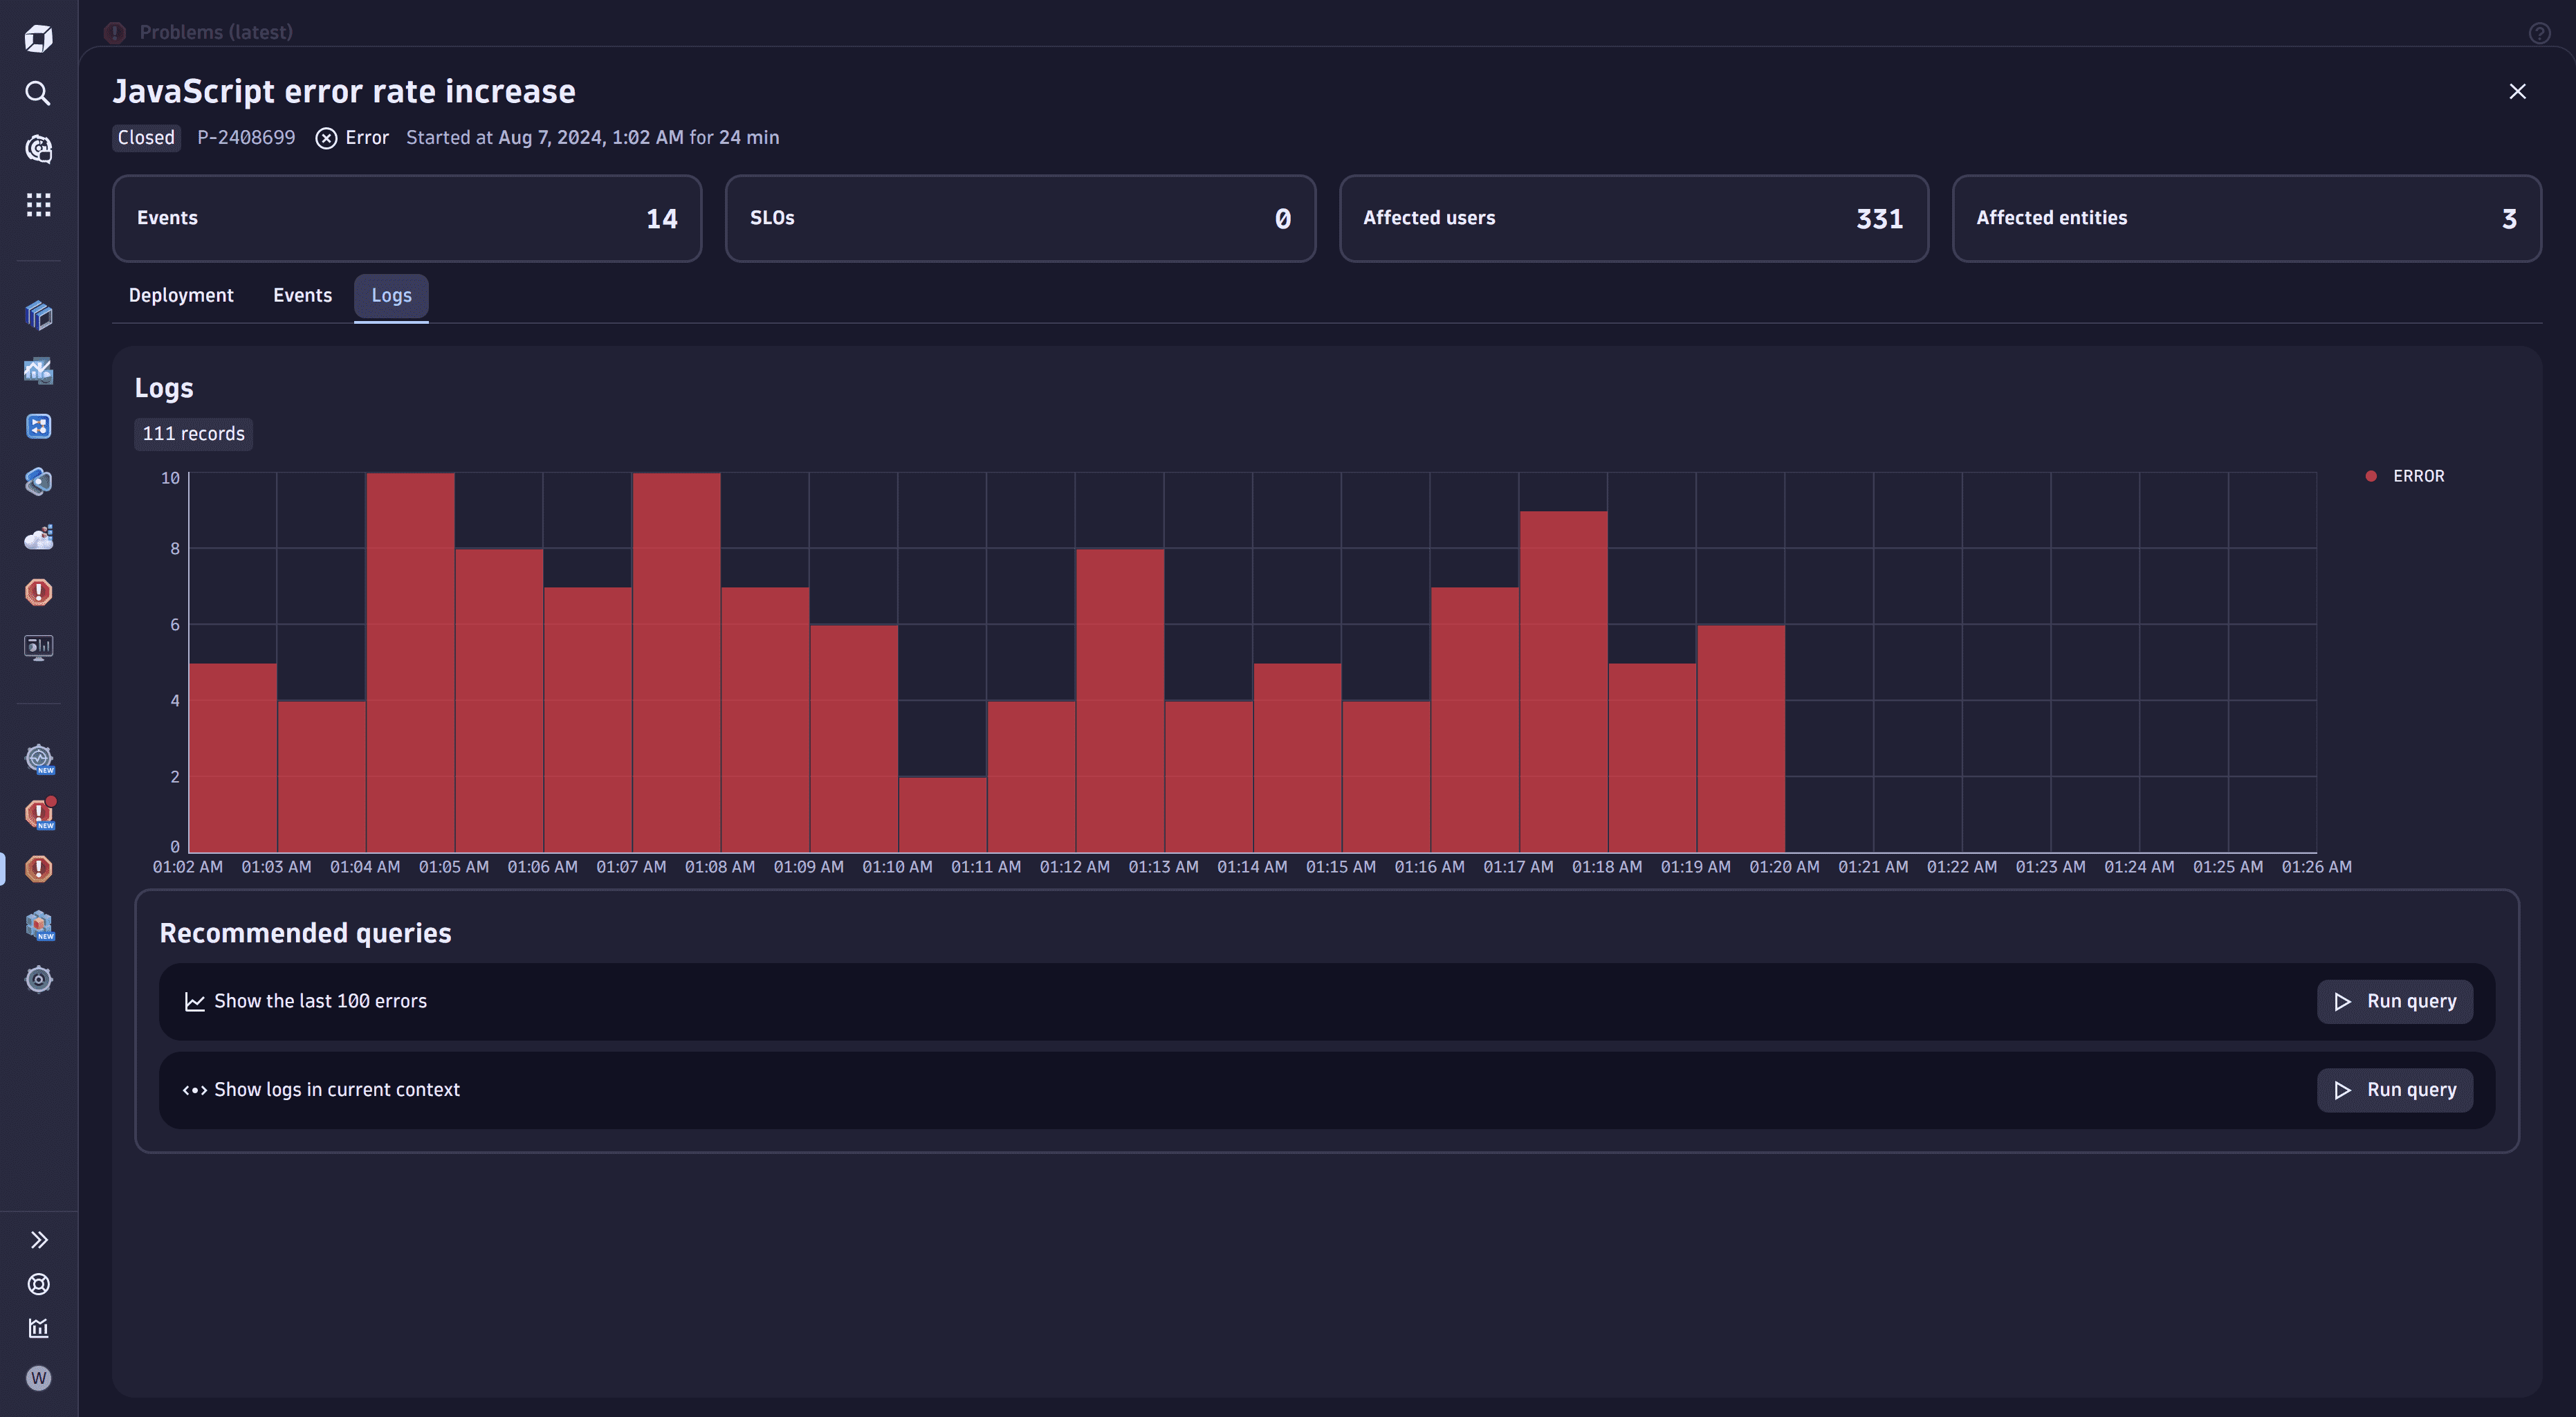
To access the log lines that were collected during the incident, select the Logs tab. Additionally, you're able to see their log level across all entities affected by the problem, allowing you to save time on manual investigations and filtering logs of relevant entities separately.
The Logs tab also includes references to the affected entities and information about all related entities, such as parent hosts. To verify which entities are affected by the problem event, you can refer to all the event properties that start with the dt.entity. prefix.
See how Logs tab summarizes all problem-relevant logs in the image below.
The image below illustrates the further sorting of the log lines with the help of a DQL query.

Problems features a global problem indicator that shows the number of active problems within the environment and is always visible in the Dock. When the Dock is collapsed, a red dot is displayed next to the app icon instead of a number.
To personalize the indicator and the number of the displayed active issues, select filters in Category and save the filter configuration by selecting the icon. The saved filter will automatically apply to the global problem indicator, reducing the number of problems counted for the user, as shown below. Selecting the Default filter button restores the last saved configuration.

While a problem filter is active, the indicator number will only show active problems from your chosen categories. The indicator updates on a one-minute schedule, which means that after the filter is updated, it can take some time for the indicator to adapt.
You can also set up email notifications for filtered problems using your email address by selecting the icon, as shown below:

The email notification is your personal setting, so you can enable it without the need for configuration permissions or the risk of impacting other users within the same environment.
The email notification is directly triggered within OpenPipeline, meaning only simple filters can be applied. Workflows that query Problems through DQL can use the complete feature set of Grail queries, such as joining tables.
If you need to send out customized email messages or have more complex automation and integration needs, you should apply a complete workflow along with the problem trigger.
The Deployment perspective equips operations teams with deeper insight into the infrastructure and cloud resources impacted by large-scale incidents. The root cause analysis feature automatically collects and visualizes affected deployments and related resources.
The additional context provided by related resources allows you to:
- Quickly understand where an affected resource resides, for example, a specific cloud region or Kubernetes cluster.
- Gather additional insight for multicloud deployments by showing an app's deployment across clouds, regions, and technology boundaries.
Deployment view uses a diagram similar to a Unified Modeling Language (UML) deployment diagram and follows a top-down approach, starting with the largest container element at the top and becoming more detailed as you drill down. The deployment structure is visualized as collapsible cards with horizontally overlapping elements, for example, services running in multiple regions. In this case, cards representing such services are duplicated and shown in multiple deployment stacks.
The deployment containing the root cause is automatically expanded and tagged with a red root cause badge, while all other deployments are collapsed by default. The deployment hierarchy is focused on a maximum of 5 levels, starting with the hierarchy leaf nodes at the bottom of the diagram upwards, seen in the example below:

Interactivity is a crucial feature of the deployment view. On the right side, you can click on any element to visualize findings, such as events related to the problem, along with a direct link to the selected entity. This structured approach allows you and your operations team to reduce the time needed to respond to incidents by navigating a familiar visual representation.
Not all incident-relevant related elements may show information on the right. Some elements, like the cloud region, are displayed for better context but may not necessarily show problem-relevant events.
Davis AI root-cause detection identifies and reports issues triggered by one or more events within a Dynatrace environment, and saves the results in the form of a problem record in Grail.
The problem record includes an array of event IDs (dt.davis.event_ids) that represents all the events collected and merged during the root-cause analysis. Event-related Problems table fields such as category, name, description, status, start, and end are derived from these events, which allows you to efficiently filter and sort all incoming problem records.
By default, Dynatrace propagates a set of built-in problem fields along with record-level permission fields, such as dt.host_group.id, k8s.namespace.name, k8s.cluster.name, onto problems. For the full list of built-in problem fields, see Record level permissions in Grail.
Other built-in and custom event fields are not automatically propagated to avoid an excessive number of problem records.
In Davis events, permission policies based on Grail record-level permissions work as expected because the fields contain single values. However, when multiple events are aggregated into a problem, the values of the same field are combined into an array. Due to the current implementation of Grail record-level permission filters, only dt.security_context supports filtering array values. Other permission fields can't be used with array-based filters in permission policies.
This behavior differs from the DQL filter functionality, where array filters on array fields are fully supported. While this limitation may impact the flexibility of permission filters, it’s important to consider when you're managing permission policies.
- Dynatrace doesn't allow you to define problem field names that repeat existing Semantic Dictionary event field names.
- You can only define problem fields for source fields with values of type
string. Fields that contain values of other types aren't supported.
Custom problem fields modification
To view or change the fields automatically propagated from events to problems, go to Settings > Analyze and alert > Root cause analysis > Problem fields. By modifying these problem fields, you can:
- Subscribe to custom record fields to be automatically propagated from all single events to any detected problem.
- Rename existing problem fields.
- Remove problem fields.
Renaming existing problem fields and removing problem fields changes current and future Grail problem records and may break your DQL queries.
To learn more about custom problem fields use cases, see Davis AI Problems use cases.
Problems allows you to create troubleshooting guides using  Dashboards or
  Notebooks to document your investigation and the steps taken to resolve the problem. The guide is based on a predefined template and contains two types of sections:
- Sections with information extracted directly from the problem.
- Template sections (such as
Initial Response & Detection,Troubleshooting, andRemediation steps) that you can edit to describe the process and steps followed to resolve the problem.
To create a troubleshooting guide
- Go to Problems and open the problem you need to resolve.
- On the problem details page, select Troubleshooting.
- Select New.
- Select Notebooks to create a new document in Notebooks.
- Select Dashboards to create a new document in Dashboards.
- Select Notebooks to create a new document in
- Follow the instructions in the template to document the details for your troubleshooting guide.
If you share a troubleshooting guide with all users in your environment, and you have enabled document suggestions based on vector similarity, Davis CoPilot will index your document and proactively suggest it to your team to help them remediate similar problems faster. To learn more about Davis CoPilot document suggestions, see Find relevant documents with Davis CoPilot.
The ability to create and share troubleshooting guides allows DevOps teams to:
- Share and spread their domain knowledge about specific business logic, software implementation, and infrastructure.
- Enrich the Dynatrace AI in their environment with shared knowledge for a more streamlined, tailored experience during problem investigation and remediation.
- Enrich the Dynatrace AI in their environment.
Dynatrace offers a wide range of tools suited for your needs, such as configuring user group permissions, Davis AI alerting rules, or OpenPipeline ingestion rules. Due to the rich customization options, however, there are cases that might lead to events not being visible in Problems and differences in the number of affected entities in the available tabs. The most common reasons for events "missing" from Problems are:
- Difference in bucket retention period: you can configure your bucket retention period for the monitored data to last longer, so that the events related to the problem will be visible regardless of how long the problem has been in the open state. To learn more about configuring bucket retention period for monitored data, see Retain trace data for long periods.
- Missing permissions necessary for viewing the event: check with your Dynatrace support group and ensure that you have necessary permissions. Ask the administrator to adjust permissions, so the event becomes visible to you.
- OpenPipeline ingestion rules dropping records: you can adjust OpenPipeline ingestion rules to prevent it from dropping any records or broaden the rules to keep records that might be connected to the alerted problem. To learn more about configuring OpenPipeline ingestion rules, see Log processing with OpenPipeline.
Problems provides drill-down options that are designed to guide you toward the most relevant actions for resolving detected problems and help you streamline problem resolution.
Drill-down options available to you are displayed within the problem details view and depend on the type of the affected entity (such as service, Kubernetes workload, host, or AWS availability zone).
Some of the available drill-down options are:
- Analyze failures: Perform a focused failure analysis to identify the root cause of failure rates, error patterns, or performance issues.
- View related logs: Investigate relevant log entries directly within Problems.
- View failed traces: Analyze failed traces in
 Distributed Tracing to understand the root cause of failures.
 - View
app: Navigate to the associated app's details page. The exact name is specific to the affected entity (such as View service, View Kubernetes workload, or View host).
To access drill-down options
- In Dynatrace, go to Problems.
- Select the problem you want to investigate from the Problems overview. This opens a problem details page.
- optional On the left side of the problem details page, select the affected entity or infrastructure you want to investigate further. Usually, when you open the problem details page, the affected entity is pre-selected for you.
- From the affected entity details on the right, select the preferred option for further investigation.
- Select > View related logs to continue the investigation without leaving Problems.
- Select > View failed traces to continue the investigation in the Distributed Tracing.
- Select > View
appto continue the investigation in one of the available Dynatrace apps. - Select > Open with to see all available investigation options.
- Select > View related logs to continue the investigation without leaving
Drill-down options provide you with seamless navigation between Problems and other Dynatrace apps to ensure focus and continuity in problem resolution.

Explore in Dynatrace Hub
Triage, investigate, and remediate incidences directly in Problems .
Dynatrace Hub
Problems